Run a prompt about your category through ChatGPT. Read the sources it lists. If your brand shows up at all, look at where the citation points. There is a good chance it is not your site. It is a trade publication, a review aggregator, a comparison roundup nobody on your team commissioned, or a five-year-old forum thread. Your homepage is not in there. Your product page is not in there. The gated report you spent six weeks on is definitely not in there.
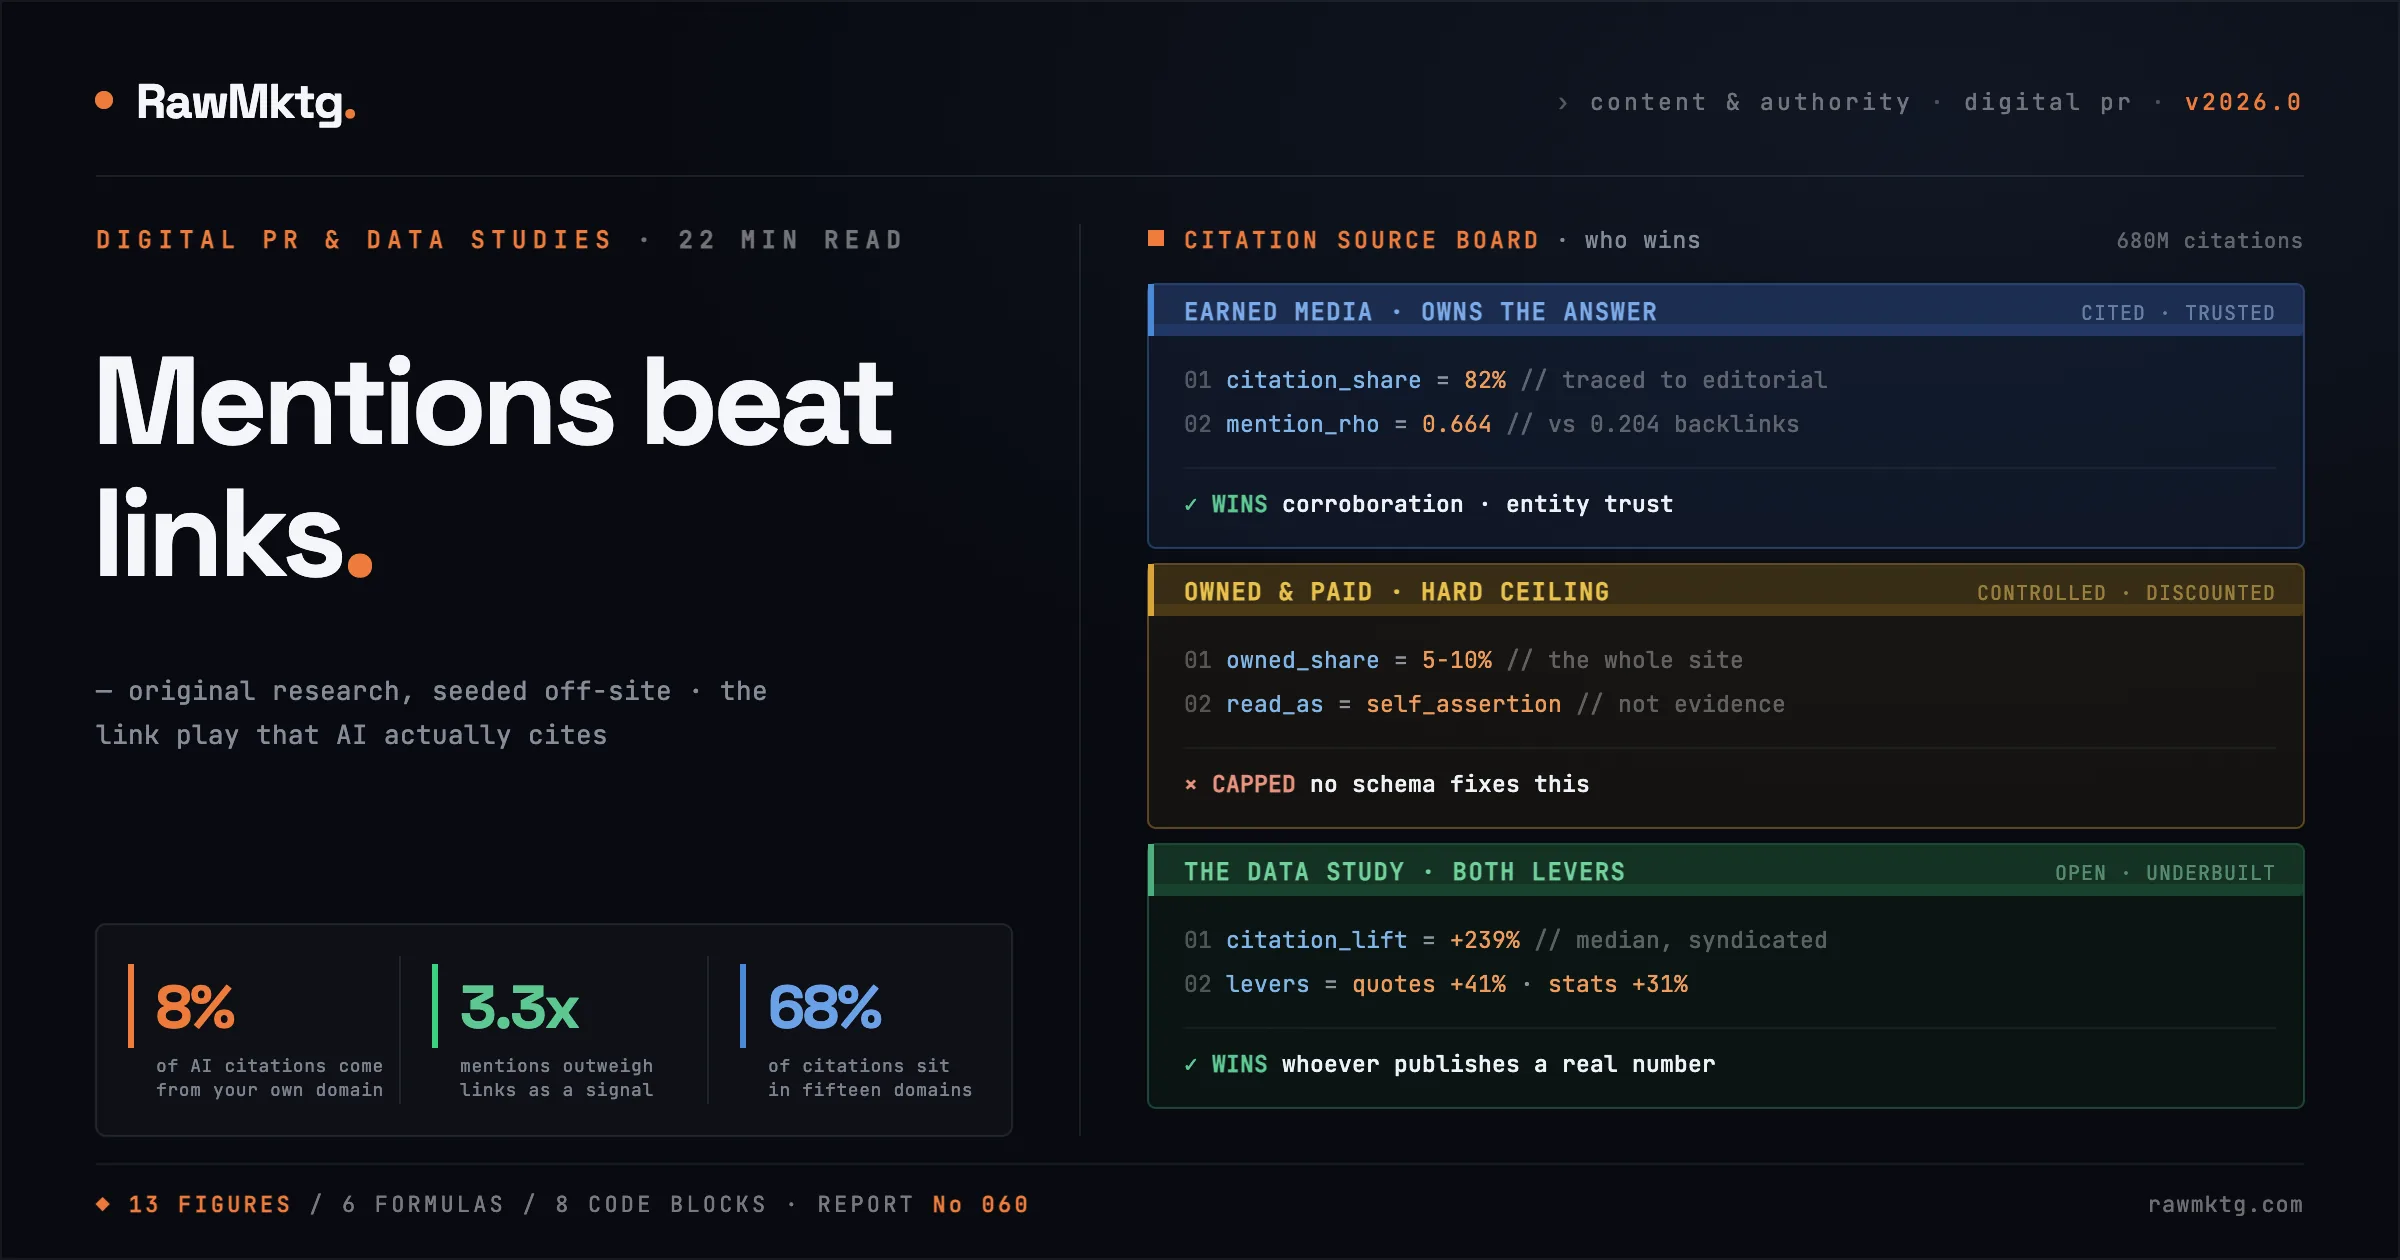
Enterprise research from McKinsey put a number on this worth sitting with. A brand's owned domain accounts for roughly 5% to 10% of source citations in AI-generated responses. The remaining 90% to 95% belongs to third-party editorial media, review platforms, industry aggregators, and community discussion you do not control and cannot buy your way into cleanly.
This is not a rendering problem or a schema problem. It is a structural one. Generative engines are aligned to discount corporate self-assertion, because a model that trusted every homepage claiming category leadership would be trivially gameable. Your site saying you are the best platform for mid-market logistics is read as marketing. An independent publication saying it is read as evidence.
The answer that keeps holding up across the data is original research, distributed by people whose job is placement. Not link building. Not brand awareness. Specifically: proprietary data, packaged into extractable units, seeded across third-party publications that generative engines already trust. This piece covers how that works, why it works, and how to build one without spending nine months on a survey nobody reads.
This is the off-site layer: what you publish, who else repeats it, and how corroboration turns into citation. On-page construction is covered in the anatomy of a high-citation page. The metric definitions are set out in Share of Model and the standard behind them at the measurement methodology. Crawler identities and robots directives are in how AI crawlers index your site. None of that is repeated at length here.
01Why did the link play stop paying?
The entire Digital PR industry was built on converting editorial coverage into followed links, and the coverage itself was almost incidental. A placement with no link was a failure you did not put in the report. That model inverted.
Read that carefully, because it is easy to draw the wrong conclusion. Backlinks did not stop mattering. A 0.204 correlation is a real signal, and the link graph still governs whether a crawler finds your page in the first place. What changed is that links are no longer the dominant term. They are one input among several, and they are outweighed by something most PR reporting does not even track. A cohort of 41 backlink audits across one segment makes the same point from the supply side: only 3.7 percent of every link relationship ever formed still carries authority.
The mechanism is straightforward once you stop thinking in ranking terms. A retrieval-augmented system assembling an answer about your category is not consulting a link graph. It is looking for the same claim, about the same entity, on multiple independent sources. That is corroboration. A link signals a relationship between two documents; a mention is direct evidence that an independent party asserted a fact about you. The taxonomy underneath this, citation versus mention versus recommendation, is covered in that piece.
| Operational dimension | Traditional SEO | Generative engine optimisation |
|---|---|---|
| Primary objective | Position on a linear rank list | Attribution inside a synthesised answer |
| Retrieval target | Document-level index and keyword match | Passage-level extraction and semantic chunking |
| Dominant authority signal | Backlink volume, domain authority, PageRank | Web-wide mention density and entity corroboration |
| Winning format | Comprehensive keyword-targeted landing pages | High-density data points, expert quotes, structured facts |
| Interaction model | Click-through to your domain | Zero-click consumption with selective attribution clicks |
| PR success metric | Followed links from DR 50+ domains | Corroborated claims across independent trusted nodes |
The decoupling shows up in the ranking data too. Longitudinal tracking suggests the overlap between top Google organic results and AI-cited sources has collapsed from around 70% to under 20%. Separate work found 83% of citations in Google AI Overviews come from pages sitting outside the organic top ten entirely. Winning position one no longer buys you a seat in the answer, the same disconnect described in ranking is not visibility. For a challenger brand this is the best news in a decade, but it only helps you if you produce the thing the synthesis layer is actually looking for.
02What does the synthesis layer actually reward?
The researchers needed new metrics, because rank position is meaningless when the output is a paragraph. Position-adjusted word count measures how much of the answer is attributable to your source, with a decay weight for citations appearing later. Subjective impression scores attribution quality across relevance, influence, uniqueness, prominence, volume, click likelihood, and diversity. The results are the closest thing the field has to a controlled experiment.
| Strategy | What was modified | PAWC | Delta | Impression | Delta |
|---|---|---|---|---|---|
| Quotation addition | Direct attributed quotes from named experts | 27.2 | +41% | 24.7 | +28% |
| Statistics addition | Qualitative claims replaced with precise numbers | 25.2 | +31% | 23.7 | +23% |
| Fluency optimisation | Clearer prose and syntax, no new data | 24.7 | +28% | 21.9 | +14% |
| Cite sources | Explicit inline citations to primary references | 24.6 | +28% | 21.9 | +14% |
| Technical terms | Domain-specific terminology and nomenclature | 22.7 | +18% | 21.4 | +11% |
| Easy to understand | Simplified explanations of complex material | 22.0 | +14% | 20.5 | +6% |
| Authoritative tone | Formal, definitive expert voice | 21.3 | +10% | 22.9 | +19% |
| Unique words | Expanded vocabulary and token diversity | 20.5 | +6% | 20.4 | +6% |
| Keyword stuffing | Repetitive insertion of target keyword strings | 17.7 | -8% | 20.2 | +5% |
The top two levers are attributed quotes and precise statistics, and both are things a content team cannot fake and a language model cannot generate. A model has no way to produce a real number from a real survey, and it carries a strong penalty for inventing one, so when a document offers a specific figure with a named methodology attached, retrieval weights it heavily because it resolves something the model cannot resolve alone. Attributed quotes work the same way: self-contained units of verifiable authority that reduce hallucination risk by anchoring a claim to a named human.
The bottom of the table is equally instructive. Keyword stuffing produced an absolute 8% decline, because neural relevance models read repetition as low-information filler, which means a decade of habit is now actively negative. Vocabulary expansion and authoritative tone barely register. You cannot write your way to citation with style. You have to bring something.
Strategies stack, and the incumbent pays
The Princeton team also tested combinations. Fluency optimisation paired with statistics addition beat every isolated strategy by more than 5.5%, and cite-sources, mediocre alone, expanded significantly when paired with quotation or statistical additions. Lift compounds, but not cleanly, because the strategies overlap in what they signal.
lift_combined  =  1  -  Π (1 - lift_i)  +  δ_overlap

  lift_i     measured single-strategy delta (e.g. quotes +0.41)
  δ_overlap  negative correction for shared signal
  Two levers at +41% and +31% do NOT stack to +85%. Model ~50%,
  treat anything above as upside.
In practice the overlap term is substantial. Do not model a 41% quote lift and a 31% statistics lift as an 85% combined gain; plan for something closer to 50% and treat anything above as upside. The more consequential finding is what happens when everyone optimises at once.
When every retrieved source for a query applies GEO principles, visibility redistributes downward. The site ranking fifth gained 115.1% through citation structuring; the incumbent at rank one lost 30.3%. Generative retrieval evaluates passage-level data density and attribution clarity rather than macro domain authority, so when the challenger's page becomes as extractable as the incumbent's, the incumbent's ranking advantage stops carrying the difference. If you are the challenger, that asymmetry is the entire strategic case. You are not trying to out-authority anyone. You are trying to out-cite them.
03Why is a data study the highest-yield PR asset?
That last property is the one that matters most and the one most teams miss. A product announcement gets covered once and dies. A statistic gets cited, requoted, aggregated into listicles, and pulled into other people's research for years. Each of those is another independent node asserting a fact that names your brand.
Field data supports the ordering. Media syndication campaigns distributing original empirical studies have produced a median 239% lift in brand citations across generative engines. Wire-distributed releases carrying original data saw their share of AI citations grow roughly fivefold across the second half of 2025. Campaigns securing thirty or more placements on DR 60+ domains have delivered a 52% increase in referring domains alongside a 52% rise in branded search demand. Separately, analysis from Muck Rack found 82% of AI citations trace back to earned editorial media, while paid and owned content combined account for about 6%. The channel most B2B teams fund least is the one doing almost all the work.
| Asset type | Signal delivered | Ingestion surface | Observed impact |
|---|---|---|---|
| Proprietary data study | Verifiable statistics, structured facts | Live retrieval and RAG indices | +239% median citation lift |
| Expert byline and commentary | Named quotes, domain authority | Training corpora and editorial archives | +41% position-adjusted word count |
| Reactive newsjacking | Temporal freshness, contextual alignment | High-frequency live crawlers | Primary driver for time-sensitive prompts |
| Review platform roundups | Category sentiment, feature and pricing facts | Vertical databases and aggregators | Decisive for best-in-category queries |
| Entity registry work | Machine-readable canonical identity | Knowledge graph grounding layers | Explains up to 49.9% of recommendation variance |
Four archetypes, one of which is nearly free
Original research does not have to mean a commissioned panel study with a five-figure invoice attached. There are four archetypes that all produce citable stat units, and they differ enormously in cost, speed, and defensibility.
| Archetype | What it is | Typical cost | Time to publish | Citation durability |
|---|---|---|---|---|
| Survey | Commissioned or panel-fielded questionnaire | $8k to $40k | 8 to 12 weeks | High, refresh annually |
| Internal telemetry | Aggregated, anonymised data from your own product | Engineering time only | 3 to 5 weeks | Very high, nobody can replicate it |
| Index or benchmark | Repeatable scoring of a public dataset or market | $3k to $15k | 6 to 10 weeks | Highest, becomes a recurring reference |
| Meta-analysis | Synthesis of existing published research | Analyst time only | 2 to 4 weeks | Low to medium, easily displaced |
Internal telemetry is worth pausing on, because most B2B SaaS companies are sitting on a publishable study and do not know it. You already log how long onboarding takes, what percentage of accounts adopt a feature in ninety days, how support volume moves with team size, or the median time to first value across segments. Aggregate it, anonymise it properly, and you have a dataset nobody else on earth can produce. A survey can be replicated by a competitor with a bigger budget; your product data cannot. When a generative engine is looking for a number about onboarding time and exactly one source has ever published one, the corroboration problem solves itself.
The legal and privacy work is real and it is the actual constraint, not the analysis. Aggregate to a level where no individual account is identifiable, run it past whoever owns your data processing agreements, and check customer contracts for clauses on aggregate reporting before anything ships. Index and benchmark studies are the other underrated option and they compound differently: a one-off survey is cited for eighteen months and goes stale, but an index published annually becomes the category reference point, so each edition inherits the citation surface of the last. The second edition is roughly half the work of the first. The fourth is a template.
A data study is expensive, slow, and hard to justify in a quarter where pipeline is soft. It is also the only asset that manufactures both of the top two citation levers at once. Most teams cut it precisely when the compounding would have started to show.
04How do you design a study a model can lift?
Three components, all mandatory. A precise number, not a qualitative hedge. A named methodology so the claim is verifiable and the model can assess it. An attributed quote from a real person with a real title, which is where the 41% lever lives. Miss any one and the block degrades into something a model can read but will not confidently repeat. You can measure how well a document does this: citable stat density counts the extractable units per thousand words.
CSD  =  ( Σ_{u∈U}  n_u · m_u )  /  (W / 1000)

  U   candidate claim units in the document
  n   1 if the unit carries a precise numeric value
  m   1 if it carries a named methodology or attribution
  W   total word count
  Blog post < 1.   Research hub should clear 4.   Below 2 = an essay with numbers.
A general blog post typically scores under 1. A well-built research hub should clear 4. Below 2 and you have written an essay with numbers in it, which is a different thing.
Design backward from the headline
The practical move is to write the press headline before you write the survey. If you cannot state the finding you are hoping for as a single sentence with a number in it, the study is not designed yet. This feels like cheating. It is not, provided you are honest about publishing the result whichever way it lands. What you are doing is making sure the instrument can produce an extractable claim at all, rather than a table of correlations that requires a paragraph to explain.
# study-spec.yaml  --  write the headline before you write the survey
study:
  title: "B2B Original Research Census 2026"
  entity: "RawMktg"                    # the brand the citation should name
  field_window: "2026-03-01/2026-03-21"

  # Every question maps to one intended stat unit.
  # If a question cannot produce a publishable sentence, cut it.
  targets:
    - id: research_frequency
      headline: "{pct}% of B2B teams run zero original research per year"
      question: "How many original research studies did your team publish in 2025?"
      scale: [0, 1, 2, "3-5", "6+"]
      stat_unit: true
      quote_prompt: "Why did your team publish that number?"   # sources the quote

    - id: budget_share
      headline: "Original research takes {pct}% of median content budget"
      question: "What share of your content budget went to original research?"
      scale: percent
      stat_unit: true
      segment_by: [company_size, acv_band]     # segment cuts = extra stat units

    - id: attribution_confidence
      headline: "Only {pct}% can attribute pipeline to a research asset"
      question: "Can you attribute closed-won pipeline to a research asset?"
      scale: [yes, no, unsure]
      stat_unit: true

  methodology:
    n: 1204
    population: "B2B marketing decision makers, 50-5000 employees"
    sampling: "panel, quota-balanced on company size and region"
    margin_of_error: 2.8          # publish this. models weight verifiable claims.
    weighting: "none"
    raw_data_url: "https://example.com/research/census-2026/data.csv"
Note the last line. Publishing the underlying dataset as a downloadable file is one of the cheapest credibility signals available, and it gives you something to mark up with Dataset schema later. Almost nobody does it, which is exactly why it works. Segment cuts are the other underused lever: one question segmented three ways produces four stat units instead of one, and segment findings tend to be more quotable than headline averages because they are specific. A journalist covering mid-market SaaS wants the mid-market number, not the blended one.
Score your own units before anyone else sees them
Once the data is in, run the draft through a scoring pass. This is a crude filter and it catches most of what would otherwise ship broken.
# score_stat_units.py  --  crude filter, catches most of what ships broken
import re
from dataclasses import dataclass

NUM    = re.compile(r"\b\d+(?:\.\d+)?\s?(?:%|pp|x|bn|m|k)?\b", re.I)
ATTR   = re.compile(r"\b(said|according to|per|told)\b", re.I)
HEDGE  = re.compile(r"\b(many|most|some|often|significant|leading|robust)\b", re.I)
METHOD = re.compile(r"\b(n\s?=|sample|surveyed|fielded|margin of error)\b", re.I)

@dataclass
class Unit:
    text: str

    @property
    def score(self) -> int:
        s = 0
        s += 2 if NUM.search(self.text)    else 0   # precise number
        s += 2 if METHOD.search(self.text) else 0   # verifiable method
        s += 2 if ATTR.search(self.text)   else 0   # named attribution
        s -= 1 if HEDGE.search(self.text)  else 0   # qualitative hedge
        s += 1 if len(self.text.split()) <= 45 else 0   # fits a chunk boundary
        return s

    @property
    def verdict(self) -> str:
        if self.score >= 5: return "CITABLE"
        if self.score >= 3: return "WEAK - add method or attribution"
        return "REWRITE"

def audit(paragraphs):
    units = [Unit(p.strip()) for p in paragraphs if p.strip()]
    citable = [u for u in units if u.score >= 5]
    words = sum(len(u.text.split()) for u in units)
    csd = len(citable) / (words / 1000) if words else 0
    for u in units:
        print(f"{u.score:>2}  {u.verdict:<32} {u.text[:64]}")
    print(f"\nCitable stat density: {csd:.2f} per 1,000 words")
    return csd
This will not catch everything and it is not meant to. What it catches reliably is the hedge sentence that felt fine in the draft, the finding that lost its methodology in an edit, and the forty-word claim that ballooned to ninety and no longer fits inside a retrieval chunk. The chunking mechanics behind that are covered in how your page gets retrieved.
05How concentrated is AI citation distribution?
This changes the shape of a campaign. Traditional Digital PR optimises for volume, because link equity accrues roughly linearly and a hundred DR 40 placements is a defensible outcome. Citation share does not work that way. Thirty placements concentrated in the domains generative engines already retrieve from will outperform three hundred spread across the long tail, because the long tail rarely enters the candidate set at all.
The corollary is that placement quality has a specific technical meaning here, and it is not domain rating. What matters is whether a domain is already being retrieved for prompts in your category, and whether the placement carries extractable facts. A DR 85 national outlet that mentions you in a listicle with no numbers is worth less than a DR 55 trade publication that reprints your headline statistic with attribution.
You can formalise this. An entity corroboration index weights each mentioning domain by how much the retrieval layer trusts it, then takes a log of mention count to reflect diminishing returns from repeat coverage on the same site.
ECI  =  Σ_j  w_j · log(1 + m_j)

  m_j  mention count on domain j
  w_j  retrieval-trust weight for domain j, 0 to 1
  The log is the point: your 4th mention on one site adds little.
  Two mentions across two domains beat four on one. Independence, not volume.
The log matters. Your fourth mention on the same publication adds very little compared to your first mention on a new one, because corroboration is about independence rather than volume. Two mentions across two domains beat four mentions on one.
| Tier | What you pitch | What it delivers | Realistic effort |
|---|---|---|---|
| Tier 1 trade press | Embargoed exclusive on the headline finding | Highest retrieval trust in-category, sets the canonical framing | 4 to 6 weeks lead, one outlet only |
| Vertical analyst blogs | Segment cuts and methodology detail | Deep citable density, strong topical association | 2 to 3 weeks, high hit rate |
| Category review sites | Data relevant to their comparison tables | Decisive for best-in-category prompts | Ongoing relationship, slow to start |
| National business press | The counterintuitive finding, framed broadly | Entity trust and knowledge graph reinforcement | Low hit rate, high payoff |
| Community and forums | The dataset itself, no pitch | Human consensus signal, up to 83.8% variance in some personas | Cannot be forced, easily backfires |
| Wire syndication | Full release with the stat block intact | Breadth and crawl surface, weak on its own | Same week, low cost |
Sequencing is worth more than most teams realise. Give the headline finding to one tier-one outlet as an exclusive, let them frame it, then run broad outreach citing that coverage. The framing the first outlet chooses tends to propagate, so you get corroboration on a consistent claim rather than fifteen slightly different restatements of the same number. Consistency of claim is what makes corroboration legible to a retrieval system.
The mention with no link is not a failure
Under the old model, a placement without a followed link was a partial win at best. Agencies were compensated on links, reports counted links, and a journalist who covered your study, quoted your executive, and reproduced your headline statistic without linking had, in reporting terms, delivered almost nothing. In the retrieval layer that placement is close to a complete win. The engine is not traversing a link to find you; it is reading the text, extracting the claim, and noting that an independent trusted domain asserted a fact naming your brand. The hyperlink is a convenience for humans. The mention is the evidence.
- Stop treating link acquisition as the outreach objective. Asking an editor to add a link is the request most likely to get your pitch declined, and you are trading a high-friction ask for a low-value asset. Ask instead that the brand name and the methodology line survive the edit.
- Do not conclude that links stopped mattering. A 0.204 correlation is still a real signal, and links remain how crawlers discover your research hub. The mention proves the claim; the link gets the crawler to the page holding your data, schema, and downloadable dataset. You want both. You should only fight for one.
The reporting change that follows is straightforward and awkward. Add unlinked mention volume as a first-class metric alongside referring domains, and track it per domain rather than in aggregate, because the corroboration index rewards breadth and discounts repetition. A dashboard showing forty mentions across thirty-one domains is telling you something a dashboard showing forty mentions is not. The off-site authority scorecard scores exactly this spread.
The stat block that goes in every pitch
Give every journalist the same extractable block. Not a press release. A block they can paste, edit lightly, and publish, with the attribution already correct.
## Headline finding
**41% of B2B marketing teams published zero original research in 2025**,
up from 28% in 2024.

Source: RawMktg Original Research Census 2026. n=1,204 B2B marketing
decision makers at companies of 50 to 5,000 employees. Fielded 1 to 21
March 2026. Margin of error +/- 2.8pp at 95% confidence.

## Attributed comment
> "Teams cut research first because it is the only line item with no
> weekly dashboard. The cost shows up eighteen months later as a
> category conversation you are not part of."
>
> Priya Menon, VP Demand Generation, Northwind

## Segment cuts
| Segment          | Zero studies | 3+ studies |
|------------------|--------------|------------|
| Under 200 staff  | 58%          | 6%         |
| 200 to 1,000     | 39%          | 14%        |
| Over 1,000       | 24%          | 31%        |

## Raw data
Full dataset (CSV, CC BY 4.0): https://example.com/research/census-2026/data.csv
Two details do disproportionate work here. The methodology sits directly under the number rather than in a footnote, so a publication that copies the claim copies the verification with it. And the licence on the raw data is permissive, which removes the friction that stops an editor from reproducing your table.
06How should you package the research hub?
This sounds contradictory until you separate the two mechanisms. Length gives you more chunks to be retrieved for; front-loading determines which of those chunks gets used when your page is picked. You need both. For a research hub, the running order that works is: the headline finding as the first sentence under the H1, a forty to sixty word definition block stating what was measured and how, the full methodology as a distinct section, then the findings one per H2 with the segment table adjacent, then the commentary. Resist the instinct to open with context. Nobody is reading your framing paragraph, and no retrieval system is chunking it usefully.
Schema for a research asset
Structured data is the part teams skip and then wonder why entity resolution is wrong. Sites with fully implemented JSON-LD achieve roughly 45% higher AI citation rates than unstructured domains. For a data study you want three types working together: Article for the write-up, Dataset for the underlying data, and Organization to bind the entity to its canonical identity. The full schema playbook is in schema markup for AI citations.
{
  "@context": "https://schema.org",
  "@graph": [
    {
      "@type": "Article",
      "@id": "https://example.com/research/census-2026/#article",
      "headline": "41% of B2B teams published zero original research in 2025",
      "datePublished": "2026-04-08",
      "dateModified": "2026-04-08",
      "author": {
        "@type": "Person",
        "name": "Priya Menon",
        "jobTitle": "VP Demand Generation",
        "sameAs": ["https://www.linkedin.com/in/example"]
      },
      "publisher": { "@id": "https://example.com/#org" },
      "about":     { "@id": "https://example.com/research/census-2026/#data" },
      "isBasedOn": { "@id": "https://example.com/research/census-2026/#data" }
    },
    {
      "@type": "Dataset",
      "@id": "https://example.com/research/census-2026/#data",
      "name": "B2B Original Research Census 2026",
      "description": "Survey of 1,204 B2B marketers on original research output",
      "license": "https://creativecommons.org/licenses/by/4.0/",
      "creator": { "@id": "https://example.com/#org" },
      "temporalCoverage": "2026-03-01/2026-03-21",
      "variableMeasured": [
        "studies published per year",
        "share of content budget allocated to research",
        "pipeline attribution confidence"
      ],
      "distribution": [{
        "@type": "DataDownload",
        "encodingFormat": "text/csv",
        "contentUrl": "https://example.com/research/census-2026/data.csv"
      }]
    },
    {
      "@type": "Organization",
      "@id": "https://example.com/#org",
      "name": "Example",
      "sameAs": [
        "https://www.wikidata.org/wiki/Q000000",
        "https://www.linkedin.com/company/example",
        "https://www.crunchbase.com/organization/example"
      ]
    }
  ]
}
The sameAs array on Organization is doing quiet but important work. It binds your domain to knowledge-graph nodes, and Wikidata entity presence alone has been observed to explain up to 49.9% of recommendation variance in B2B contexts. If you have no Wikidata entity, that is a separate project and it is worth starting, as covered in becoming an entity. Then confirm retrieval crawlers can actually reach the hub. Training crawlers and live retrieval crawlers are different bots with different consequences, and blocking the wrong one removes you from real-time answers entirely.
# robots.txt
# Live retrieval. Blocking these removes you from real-time AI answers.
User-agent: OAI-SearchBot
Allow: /

User-agent: PerplexityBot
Allow: /

User-agent: Claude-Web
Allow: /

User-agent: Googlebot
Allow: /

# Training crawlers. Allow or block on IP strategy, not on GEO strategy.
User-agent: GPTBot
Allow: /

User-agent: Google-Extended
Allow: /

Sitemap: https://example.com/sitemap.xml
Blocking GPTBot to protect intellectual property, then discovering the research hub you built for AI visibility is absent from ChatGPT answers. GPTBot handles training. OAI-SearchBot handles live retrieval and citation. They are separate directives, and the second one is the one that matters for this campaign.
07How do you measure this without fooling yourself?
| Metric | What it counts | What it tells you | Working benchmark |
|---|---|---|---|
| AI answer inclusion rate | Share of prompt runs where you appear as a source at all | Macro discovery reach | Above 65% on category prompts |
| Citation rate | Share of runs containing a clickable link to your domain | Direct attribution capture | Above 35% |
| Brand mention share | Share of responses naming your brand across a competitive prompt set | Competitive share of voice | Beat your closest rival by 1.5x |
| Sentiment delta | Whether you are recommended positively, neutrally, or conditionally | Commercial framing quality | Net positive above +0.75 |
BMS  =  ( 1 / (P·R) )  Σ_p Σ_r  [ brand ∈ A_{p,r} ]

  P   prompts in the fixed set     R   runs per prompt
  A   answer text for one run
  One run per prompt swings several points for no reason.
  Five runs is a floor. Ten is better. See the methodology.
Run count matters more than people expect. Generative outputs are stochastic, and a single run per prompt produces a number that moves several points between measurements for no reason at all. Five runs is a working minimum, ten is better if you can afford the calls, and the full sampling standard is on the measurement methodology page.
# scan_prompt_set.py  --  the cited domains are your outreach list
import json, statistics
from collections import defaultdict

PROMPTS = [
    "best container tracking software for freight forwarders",
    "how do freight forwarders track ocean containers",
    "terminal49 vs project44",
    "container visibility platforms compared",
]
BRAND       = "example"
COMPETITORS = ["rival-one", "rival-two"]
RUNS        = 8

def scan(client, prompt, runs=RUNS):
    """Return per-run mention and citation flags for one prompt."""
    out = []
    for _ in range(runs):
        answer, sources = client.ask(prompt)      # your provider wrapper
        low = answer.lower()
        out.append({
            "mentioned":   BRAND in low,
            "cited":       any(BRAND in s.lower() for s in sources),
            "competitors": [c for c in COMPETITORS if c in low],
            "sources":     sources,
        })
    return out

def summarise(client):
    runs, domains = [], defaultdict(int)
    for prompt in PROMPTS:
        for r in scan(client, prompt):
            runs.append(r)
            for s in r["sources"]:
                domains[s.split("/")[2]] += 1
    n = len(runs)
    bms = sum(r["mentioned"] for r in runs) / n
    cr  = sum(r["cited"]     for r in runs) / n
    rival = statistics.mean(
        sum(c in r["competitors"] for r in runs) / n for c in COMPETITORS
    )
    print(f"Brand mention share : {bms:.1%}")
    print(f"Citation rate       : {cr:.1%}")
    print(f"Mean competitor BMS : {rival:.1%}")
    print(f"Ratio vs rivals     : {bms / rival:.2f}x" if rival else "")
    print("\nTop cited domains (your citation surface):")
    for d, c in sorted(domains.items(), key=lambda kv: -kv[1])[:15]:
        print(f"  {c:>4}  {d}")
The last block of that output is the most useful part and the one people ignore. The domains being cited for your category prompts are your outreach list. You do not have to guess which publications the retrieval layer trusts. It tells you, every time you run the scan. The end-to-end version of this loop is prompt-to-citation tracking.
The lag will test your nerve
Citation lift does not arrive with the placements. Coverage goes live, mention counts climb, and the citation metric sits flat for weeks while crawlers refetch, indices update, and corroboration density crosses whatever threshold the retrieval layer applies.
Plan for this in the reporting cadence, not just the strategy deck. If the leadership review lands in week seven, you will be presenting a flat citation line with a healthy placement count and no way to connect them. Set the expectation at kickoff that mentions are the leading indicator and citations the lagging one, and report both from week one so the relationship is visible before anyone needs it to be.
The traffic you cannot see
Then there is the attribution problem, which is worse than most analytics teams realise. Roughly 70.6% of generative AI referral sessions arrive with the HTTP referrer header stripped, which means GA4 files them under Direct.
The distortion compounds. Baseline direct traffic converts at around 2.46%. The Dark AI sessions hiding inside that bucket convert at roughly 10.21%, a 4.1x premium. Blended together, the Direct channel looks slightly better than usual and nobody investigates, while the PR campaign that produced the highest-intent traffic on the site reports almost nothing.
| Channel as recorded | Share of AI sessions | Referrer header | Conversion rate | Attribution outcome |
|---|---|---|---|---|
| Visible AI referral | 29.4% | Intact | 10.21% | Correctly credited |
| Dark AI | 70.6% | Stripped | 10.21% | Filed as Direct |
| Genuine direct | Not AI | None | 2.46% | Correct, but now diluted |
A rough estimate of the hidden revenue is better than no estimate.
hidden_revenue  ≈  D · φ · c · V

  D    unsegmented monthly Direct sessions
  φ    0.706  share of AI referrals with the referrer header stripped
  c    0.1021 observed Dark-AI conversion rate
  V    average order value / annual contract value
  A model, not a measurement. Label it as one in any deck.
# dark_ai_estimate.py  --  split a Direct bucket into dark-AI + genuine
PHI    = 0.706     # share of AI referrals arriving without a referrer header
C_DARK = 0.1021    # observed conversion rate of dark AI sessions
C_BASE = 0.0246    # baseline conversion rate of genuine direct traffic

def decompose(direct_sessions, direct_conversions, acv):
    """Solve: direct_conversions = d*C_DARK + (direct_sessions - d)*C_BASE
    for d, the implied dark-AI session count. Cross-check against PHI."""
    implied_dark = (direct_conversions - direct_sessions * C_BASE) / (C_DARK - C_BASE)
    implied_dark = max(0.0, min(implied_dark, direct_sessions))
    return {
        "implied_dark_sessions":     round(implied_dark),
        "implied_total_ai_sessions": round(implied_dark / PHI),
        "hidden_conversions":        round(implied_dark * C_DARK),
        "hidden_revenue":            round(implied_dark * C_DARK * acv),
        "dark_share_of_direct":      round(implied_dark / direct_sessions, 3),
    }

if __name__ == "__main__":
    # 84,000 direct sessions, 3,120 conversions, $9,400 ACV
    for k, v in decompose(84_000, 3_120, 9_400).items():
        print(f"{k:<28} {v:,}")
Two ways to reduce the guesswork. Tag every URL you place in a press kit or syndicated release so at least the linked subset is unambiguous. And build a Direct-bucket cohort report segmented by landing page, because Dark AI sessions land disproportionately on deep informational pages rather than the homepage, which is not how genuine direct traffic behaves.
08What does a 90-day sequence look like?
- Days 0 to 21. Baseline everything before you change anything. Run the prompt scan, record brand mention share and citation rate against two competitors, capture the cited-domain list. In parallel, verify crawler access and ship the schema. This is the only thing that lets you prove causation later.
- Days 7 to 42. Design and field the study. Write the headline sentences first, cut every question that cannot produce one, and field on a panel unless your list is genuinely representative. Twenty-one days of fielding is enough for most B2B panels.
- Days 42 to 59. Analysis, stat-unit extraction, and hub build. Score the draft for citable density before it ships. Front-load the finding. Publish the raw data.
- Days 56 to 90. Distribution in sequence: exclusive to one tier-one outlet, then broad outreach citing that coverage, then wire syndication, then expert commentary on the outlets that covered it. Do not run these simultaneously.
- Days 80 to 90. Mention harvest and citation re-scan against the same prompt set, same run count, same competitors. Expect mentions to have moved and citations to be only starting to.
Then hold. The single most common failure mode is publishing one study, seeing mention lift without citation lift at day ninety, and concluding the strategy does not work. The compounding is real but it runs on the retrieval layer's refresh cycle, not yours. Cost per incremental citation point is the number to bring to the second budget conversation.
cost_per_point  =  total_campaign_cost  /  Δ brand_mention_share

  Δ in percentage points, same prompt set before and after.
  Looks bad after one study. Reasonable after three.
  That is the asset behaving honestly, not a presentation trick.
It will look bad after one study and reasonable after three, which is an accurate reflection of how the asset behaves rather than a presentational trick. The compounding dynamics are the subject of the GEO compounding flywheel.
09Where does this break?
- The correlation figures are not causal. A 0.664 correlation between mention density and citation is strong, and still correlation. Brands that get mentioned a lot are also large, funded, and covered for reasons unrelated to their PR programme. Treat it as a direction, not a coefficient.
- Benchmark figures come from mixed bases. The +239% lift, the 82% earned-media share, and the 68% domain concentration come from different studies with different methodologies and definitions. The ordering is consistent across sources; the absolute values are directional.
- Hallucination is a live risk on your own data. A joint BBC and European Broadcasting Union study found 81% of AI assistant responses contained factual inaccuracies, 45% with significant errors. Your statistic will be misquoted. Publishing the methodology adjacent to the number is partial defence; monitoring for the misquote is the rest.
- Category concentration varies enormously. The top-fifteen-domain figure is an aggregate. In technical B2B, community sources and documentation carry far more weight than trade press. Run the scan on your own prompt set before you buy anyone's target list.
- This does not work without a real finding. A study designed purely as a link asset, with a thin sample and a predetermined conclusion, gets covered by the outlets that cover anything and cited by nothing. The extraction layer has no taste, but the journalists in the top fifteen domains do, and they are the gate.
The strategic case survives all of that. Owned content has a hard ceiling of roughly a tenth of the citation surface. The synthesis layer rewards precise numbers and named attribution above every other content property tested. Third-party corroboration is the mechanism that converts one into the other, and original research is the only asset that produces all three at once.
Frequently asked questions
Do backlinks still matter for AI search?
Yes, but they are no longer the dominant signal. An Ahrefs analysis of roughly 75,000 brands found web-wide brand mention frequency correlates with AI citation inclusion at a Spearman coefficient of 0.664, against 0.204 for backlink volume, so mentions are about three times the signal links are. Links have not stopped working: a 0.204 correlation is real, and the link graph still governs whether a crawler discovers your page at all. What changed is that an unlinked mention on an independent trusted site is now direct corroboration a retrieval system can use, and it often outweighs the link.
Why does my own website barely get cited?
Because generative engines are aligned to discount corporate self-assertion. A model that trusted every homepage claiming category leadership would be trivially gameable, so your own domain accounts for only about 5% to 10% of the source citations in AI answers (McKinsey), and roughly 82% trace back to earned editorial media (Muck Rack). Your site saying you are the best is read as marketing; an independent publication saying it is read as evidence. The fix is not schema, it is third-party corroboration.
What is the single highest-yield digital PR asset for AI citations?
An original data study. It is the only asset that natively produces both of the top two citation levers the GEO research identified: precise statistics (a model cannot invent a real number) and named attributed quotes (a self-contained unit of verifiable authority). It also produces claims that get requoted and aggregated for years, each restatement another independent node naming your brand. Media syndication of original studies has produced a median 239% lift in brand citations across generative engines.
How do I make my research extractable by AI?
Build it in stat units: a precise number, a named methodology, and an attributed quote, in a block short enough to survive chunking (under about 45 words). Measure citable stat density (extractable units per 1,000 words); a research hub should clear 4. Front-load the finding, since 44.2% of LLM citations come from the first 30% of a document. Put the methodology directly under the number so anyone who copies the claim copies its verification, publish the raw dataset under a permissive licence, and mark it up with Article + Dataset + Organization JSON-LD.
Is a media mention without a link worth anything for AI?
For AI retrieval it is close to a complete win. The engine reads the text, extracts the claim, and notes that an independent trusted domain asserted a fact naming your brand; the hyperlink is a convenience for humans, the mention is the evidence. So stop making a link the outreach objective, which is the ask most likely to get your pitch declined, and instead ask that the brand name and the methodology line survive the edit. Track unlinked mention volume per domain as a first-class metric, because corroboration rewards breadth across independent sites over repetition on one.
How many domains do I actually need to target?
Fewer than a link campaign. Analysis by 5WPR across 680 million AI citations found the top fifteen publishing domains capture roughly 68% of total AI citation share, a steep power law. Thirty placements concentrated in the domains that generative engines already retrieve from will outperform three hundred spread across the long tail, because the long tail rarely enters the candidate set. Run a prompt scan on your own category first: the domains cited for your prompts are your outreach list, and the retrieval layer tells you what it trusts every time you run it.
How long before a digital PR campaign moves AI citations?
Longer than the placements. Coverage goes live and mention counts climb, but the citation metric usually sits flat for weeks while crawlers refetch, indices update, and corroboration density crosses the retrieval layer's threshold. Set the expectation at kickoff that mentions are the leading indicator and citations the lagging one, and report both from week one. The most common failure is publishing one study, seeing mention lift without citation lift at day ninety, and concluding it does not work: the compounding runs on the retrieval layer's refresh cycle, not yours.
Figures 1 through 13 are original, built from the data in the sources below.
- GEO: Generative Engine Optimization. Aggarwal et al., ACM SIGKDD 2024.
- What the GEO paper shows for your business. Elementera.
- How Marketers Are Increasing GEO Traffic in 2026. The Digital Bloom.
- Generative Engine Optimization Statistics 2026. Omnibound.
- LLM Seeding: How Brands Build Visibility Before AI Tools Cite Them. Brandastic.
- How Digital PR Builds Your Brand in AI Overviews. StudioHawk.
- What Is GEO? Generative Engine Optimization for AI Citations. AuthorityTech.
- Generative Engine Optimization: Complete Guide to AI SEO. Navoto.
- The Complete Guide to Generative Engine Optimization. Geol.ai.
- GEO Knowledge Base. Metricus.
- Schema Markup for AI Search: Complete Guide. Vryse.
- AI Crawlers Explained: GPTBot, ClaudeBot, PerplexityBot. Anagram.
- Robots.txt Guide: Essential Rules and Disallow Best Practices. Conductor.
- Robots.txt for AI Crawlers: 2026 Template. Cubitrek.
- What Is Digital PR? AI and SEO Visibility Guide 2026. Exposure Ninja.
- Why Digital PR Is Important and How to Build a Strategy. 2Point Agency.
- Building AI Search Content Authority Beyond Rankings. Moonrank.
- What Is GEO? AI Search Visibility for Marketing Pros. GEO Tool.
- GEO official reference page. Grounding Page.
- Methodology and Sources, AI Search Visibility Research. info.link.
- Search Everywhere Optimization for 2026. Surfer.
- Perplexity Tracking and SEO for Brand Citations. LLM Pulse.
rawmktg. publishes data-driven teardowns and technical playbooks on GEO, agentic commerce and B2B AI-search visibility. Method: same data, same lens, every time. Contact: vinayak@rawmktg.com
Sources: the Princeton/Georgia Tech/AI2/IIT Delhi GEO experiment, an Ahrefs analysis of ~75,000 brands, McKinsey source-mix data, Muck Rack and 5WPR citation studies, and 2026 GEO benchmarks. Correlations are directional, not causal; magnitudes are drawn from mixed bases.