Over the past few months, we audited six leading B2B SaaS companies operating in the customer experience and survey software space, a market that spans NPS tools, customer feedback platforms, employee engagement software, and CX management suites. The companies ranged from dominant market incumbents to well-funded challengers.
The patterns were remarkably consistent. Across technical infrastructure, content strategy, backlink quality, and AI visibility, the same structural mistakes appeared again and again, made at scale by companies with every resource available to avoid them.
Here is what the data showed.
1. Which CX SaaS companies dominate organic traffic, and by how much?
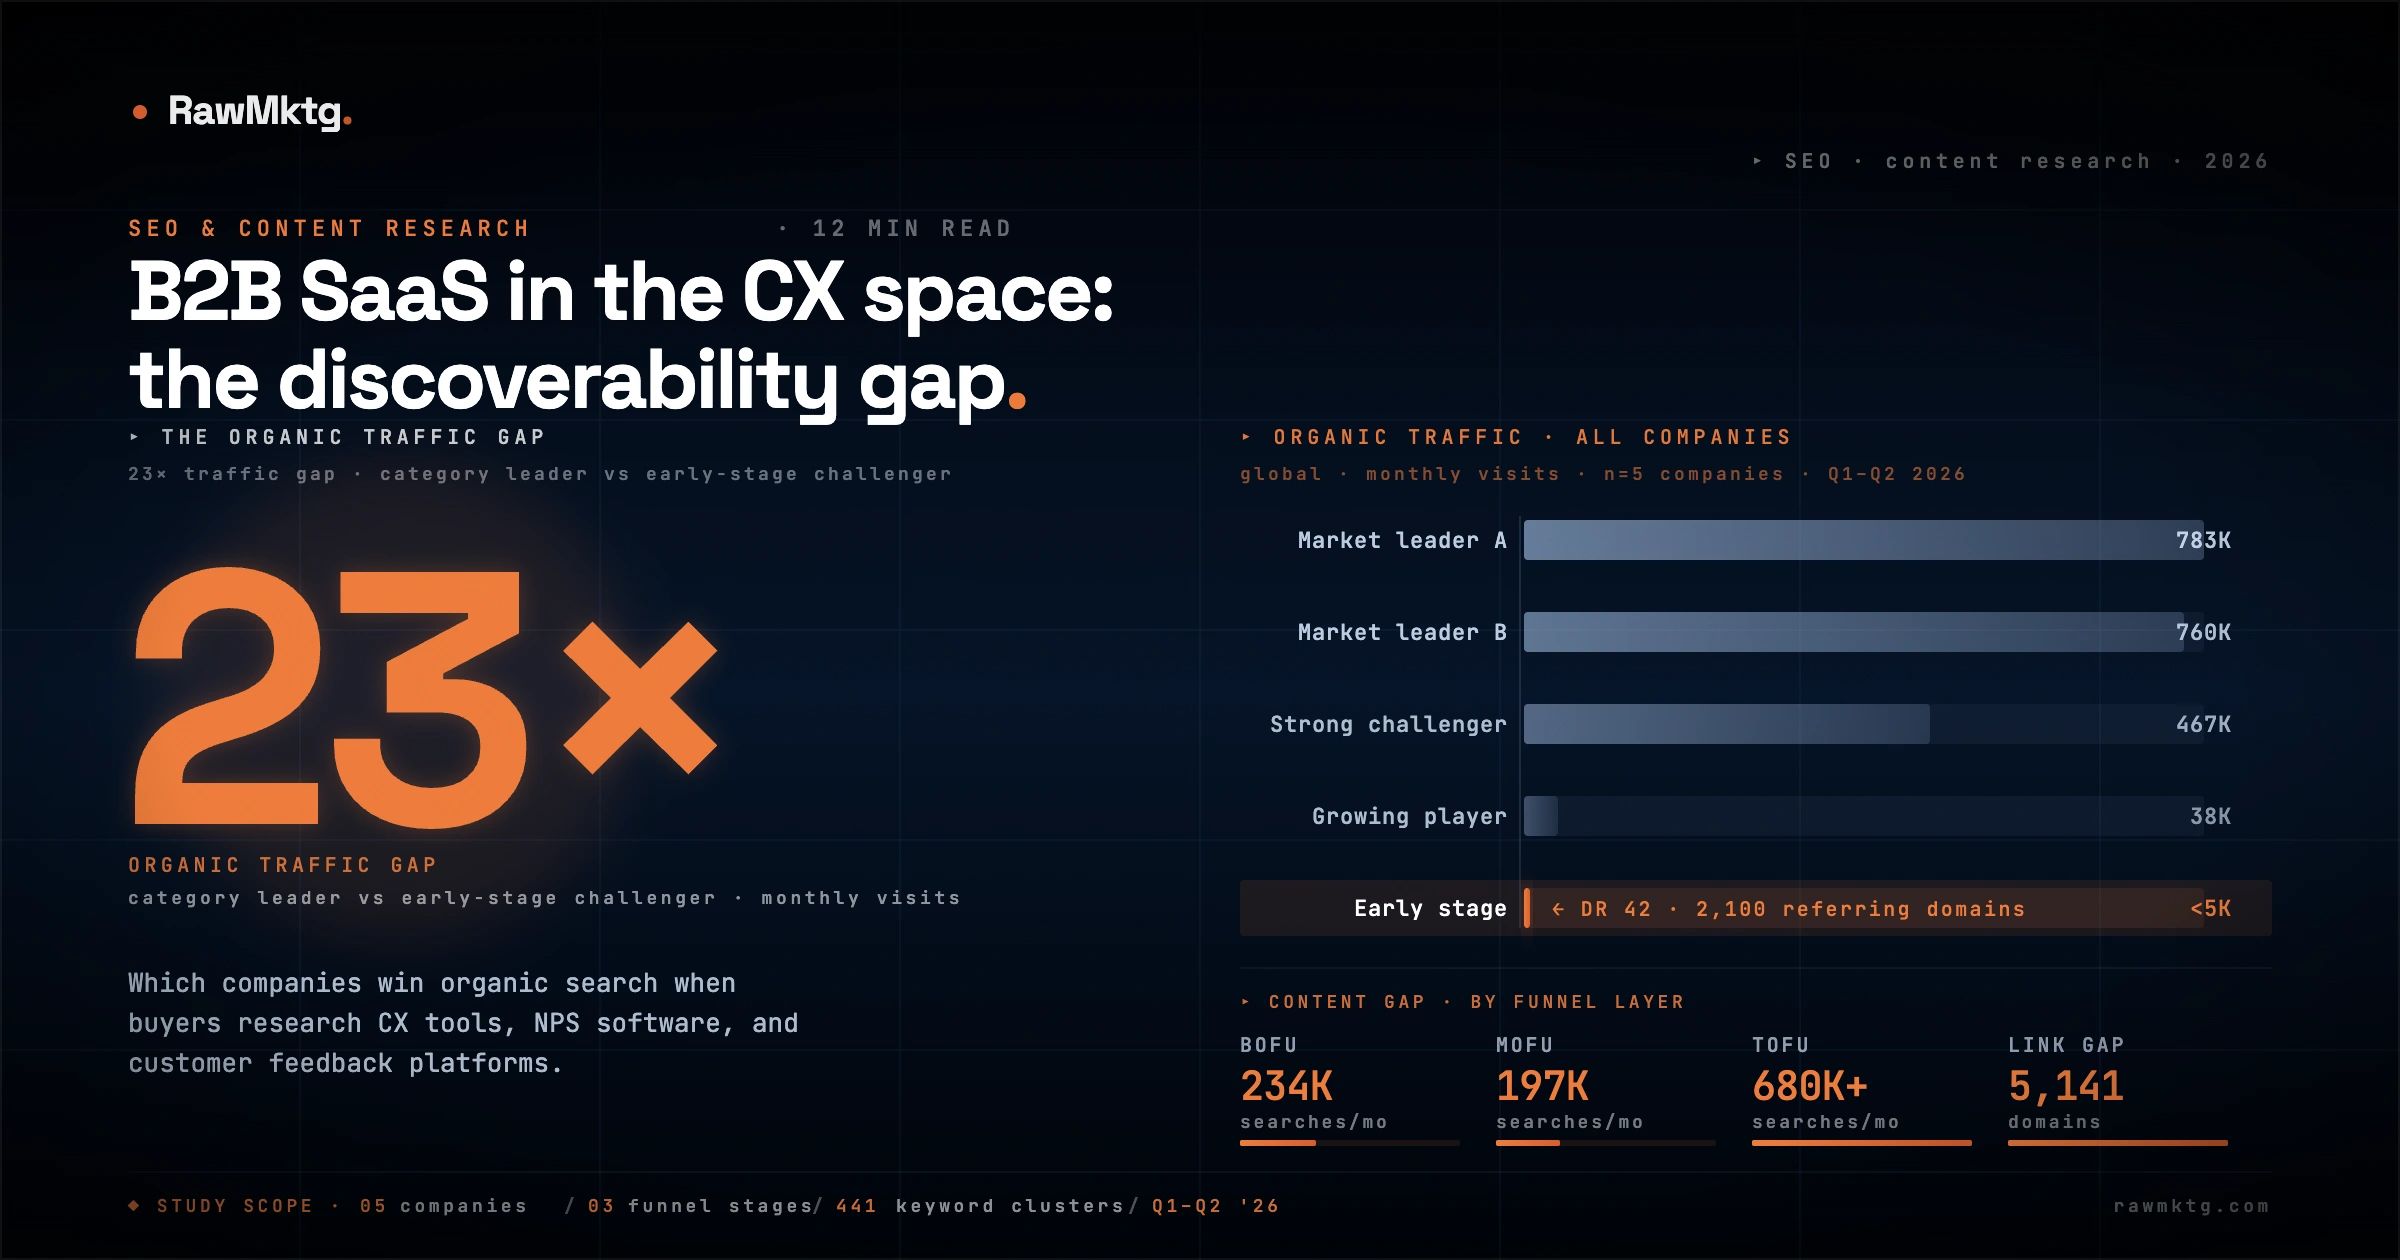
The first thing that jumps out when you put six CX SaaS companies side by side is the staggering disparity in organic search traffic, and how poorly it correlates with product quality or even funding.
The two market leaders in our analysis attract roughly 760,000 and 783,000 monthly organic visits respectively. The challengers ranged from 33,000 to 467,000. One company in the same competitive set, with a comparable product, captured fewer than 5,000 visits per month.
That is a 150-fold difference in organic traffic between companies selling to the same buyer, targeting the same ICP, and competing for the same enterprise contracts.
The traffic leaders are not winning because they have a better product. They are winning because they have built a content machine that captures demand at every stage of the funnel, from someone Googling "what is a Likert scale" at the top, to someone comparing pricing pages at the bottom. The keyword count tells the story clearly:
| Company Tier | Keyword Count | Monthly Traffic |
|---|---|---|
| Market leaders | 33,000 – 37,000 | 760,000 – 783,000/mo |
| Strong challengers | 6,600 – 8,900 | 420,000 – 467,000/mo |
| Growing players | 3,300 – 5,400 | 33,000 – 38,000/mo |
| Early stage | < 500 | < 5,000/mo |
The companies with 33,000+ keywords are not just ranking for more things. They are ranking for the right things, product-adjacent topics that their buyers search for during every stage of the evaluation journey. They have built topical authority that acts as a compounding moat. The companies with fewer than 6,000 keywords are essentially invisible to buyers who have not already heard of them.
2. Is technical SEO undermining CX SaaS content investment?
Here is the finding most CMOs and growth leaders do not want to hear: a significant portion of content investment in B2B SaaS is being wasted because the technical foundation is not right.
In our audit of one representative company in the space, a detailed crawl of 4,272 pages revealed a site health score of 71%. That number sounds manageable until you see what is inside it.
1,496 indexable pages had zero incoming internal links. That is over 35% of the crawled inventory effectively abandoned inside the site's own architecture. These pages receive no PageRank from the internal link graph. Google's crawler has little reason to crawl them frequently, and even when it does, the pages do not accumulate the authority signals needed to rank.
When you are investing in content at scale, this is a silent tax on everything you produce. Blog posts, guides, landing pages, templates, if they are not being internally linked, they are not compounding. They are just sitting there.
The other issues were similarly systemic:
- 429 pages with title tags exceeding 60 characters, all truncated in SERPs
- 303 pages with over-length meta descriptions that Google routinely ignores
- 693 pages with multiple H1 tags, a template-level defect affecting the primary on-page keyword signal for 16% of all crawled pages
- 3,388 images over 100KB, the root cause of poor Core Web Vitals scores across the site
None of these are rare or unusual. Across the CX SaaS space, this pattern is the norm. The irony is that fixing these issues is less expensive than creating new content. A single engineering sprint to address orphan pages, title tag templates, and image compression would deliver a more immediate ranking impact than six months of new articles. But it is less visible to the business, harder to report on, and rarely gets prioritised.
3. Is the CX SaaS content funnel inverted?
When you map the content libraries of CX SaaS companies against the buyer journey, you find a consistent pattern: the funnel is inverted. There is a heavy concentration of TOFU (top-of-funnel) content, a significant gap in the MOFU (consideration) layer, and a near-complete absence of BOFU (decision-stage) content that would actually convert.
Our structured content gap analysis identified 76 keyword clusters representing 441 individual keyword opportunities, topics where multiple competitors rank but where the challenger companies have no content at all.
| Funnel Stage | Clusters | Keywords | Monthly Searches |
|---|---|---|---|
| TOFU: Awareness | 42 | 237 | ~680,000+ |
| MOFU: Consideration | 22 | 128 | ~197,000 |
| BOFU: Decision | 12 | 76 | ~234,000 |
The TOFU layer has the most clusters, but BOFU and MOFU combined represent over 430,000 monthly searches, buyers actively researching, evaluating, and selecting tools. These are the people closest to signing a contract.
The specific BOFU clusters that CX SaaS challengers are systematically missing include employee engagement platform keywords (73,900 monthly searches), online survey maker terms (30,400), online poll and quiz maker terms (58,000+), NPS software terms (4,450), and CSAT software terms (3,200). These are not obscure long-tail queries, they are the core product category terms buyers type when they have decided they need a tool and are actively comparing options.
There is a deeper pattern beneath this. The single most valuable TOFU cluster in our analysis is a group of statistical concepts used in survey research, margin of error, sample size calculators, confidence intervals. Combined, these terms drive nearly 100,000 monthly searches. A person Googling "margin of error calculator" is, with high probability, designing a survey or evaluating a survey platform's methodology. They are directly in the CX SaaS buyer's ICP. Market leaders understood this years ago. Challenger companies are still writing primarily about their own features.
4. Where are CX SaaS deals actually won in search?
Middle-of-funnel content is the hardest to produce well and the most valuable to own. It is where a buyer who knows they have a problem starts researching solutions. It is where thought leadership actually influences purchasing decisions. And across the CX SaaS companies we analysed, it is the most consistently underdeveloped part of the content strategy.
The 22 MOFU clusters we identified are anchored by some of the most commercially significant topics in the space:
- Voice of Customer (VoC) programs, the single highest-volume MOFU cluster at 42,950 monthly searches. Only two companies in our analysis rank meaningfully for VoC content, and both are market incumbents.
- Customer feedback surveys, 35,700 monthly searches. Buyers who have acknowledged they need feedback and are now researching how to do it well. Market leaders capture the majority of this traffic with dedicated learning hubs.
- 360-degree feedback and performance review content, 15,500 monthly searches. Overlaps directly with the employee experience features several CX platforms offer. Fewer than two companies have built content specifically targeting this cluster.
The pattern is consistent: challenger companies produce excellent product-focused content about their own features, and skip the educational middle layer that brings buyers to the table in the first place.
5. What is wrong with CX SaaS backlink profiles?
The backlink analysis told one of the most striking stories in the entire audit, and it has two dimensions.
On gap: when we ran a link intersect analysis across all six companies, we found 5,141 domains with a Domain Rating of 40 or higher that link to both market leaders but have zero links to the challenger companies. These are not spammy directories. They include high-authority technology publications, software review platforms, CX-specialist media, HR tech blogs, and market research directories that AI models cite heavily when answering software recommendation queries.
| Domain Category | Gap Domains (Est.) | Impact Type |
|---|---|---|
| Software review platforms (G2, Capterra, GetApp, TrustRadius) | ~80 | Direct AI citation + buyer referral |
| CX/product niche publications | ~120 | Brand awareness + topical authority |
| NPS/CX specialist sites | ~40 | High-relevance, AI-weighted citations |
| Market research directories | ~35 | Specialist authority |
| Tech/business publications | ~75 | Editorial authority + AI source weight |
On quality: raw referring domain count is one thing. Profile quality is another. One mid-tier CX SaaS company in our analysis had 7,500 referring domains, a number that suggests a healthy backlink profile. But when we filtered by spam classification, 2,158 of those domains (29%) were spam. Nearly a third of the profile was noise at best and a potential algorithmic liability at worst.
The companies with the strongest organic performance in our analysis had significantly lower spam percentages and significantly higher concentrations of links from niche-relevant, editorially-placed domains. The correlation between link quality and organic traffic was consistent across our entire sample. A link building strategy optimised for volume is likely creating a profile that looks impressive in a dashboard while delivering diminishing returns in actual rankings.
6. Is AI visibility the new CX SaaS moat?
This is perhaps the most forward-looking finding in our analysis, and the one with the longest tail of strategic implications.
A procurement manager at a 500-person company asks ChatGPT, Perplexity, or Google AI Overviews: "What is the best customer feedback tool for a mid-market SaaS company?" and uses the response as a starting framework. The companies that appear in those AI-generated responses are not selected at random. Large language models pull from a specific set of trusted signals:
- Domain authority and breadth of referring domains, particularly from review aggregators and tech publications the model has been trained on most heavily
- Structured comparison content, X vs Y, best tools for Z, alternatives to X, explicitly designed for evaluation
- Frequency of mention across trusted third-party sources, the more often a brand appears in G2 reviews, Capterra listings, TechRadar articles, and HubSpot roundups, the more likely it is to surface in AI responses
When we analysed citation source coverage across our six companies, the results were stark. Market leaders appeared in virtually all of the domains that AI models treat as authoritative: major tech publications, primary review aggregators, CX-specialist directories, HR/people analytics blogs.
The challengers were largely absent, not because AI models have explicitly excluded them, but because the underlying signal infrastructure that feeds AI citation decisions simply does not include them. As AI-mediated discovery grows, this gap compounds. Businesses building GEO infrastructure today, structured comparison content, deep review site presence, editorial mentions in AI-trusted publications, are building a moat that will be significantly more expensive to replicate in two to three years.
What the Data Tells Us About B2B SaaS Growth in 2026
Pulling back from the specifics of the CX space, several patterns in this data generalise to B2B SaaS more broadly.
Technical debt is the silent multiplier. Every company in our analysis has invested in content. Very few have maintained the technical infrastructure that makes that content compound. Orphan pages, over-length title tags, unoptimised images, these sit underneath every other growth initiative. Until they are addressed, content and link building programs deliver 60–70% of their potential at best.
The funnel inversion is nearly universal. B2B SaaS companies produce TOFU content because it is easier to justify and harder to attribute to revenue. BOFU content is harder to create, requires deeper product knowledge, and sits closer to the conversion event, but it is where the commercial leverage actually lives. The companies that win organically have cracked BOFU before they scaled TOFU.
Link quality is outpacing link quantity as a differentiator. As Google's algorithms mature and AI models develop their own citation preferences, the value of a high-relevance, editorially-placed link from a niche-specific domain is accelerating relative to a generic, volume-built profile. The companies building niche authority today are building something that will be harder to replicate with every passing quarter.
AI visibility is not a future problem. It is a present one. The brands being recommended in AI-generated software evaluations today are the ones that built the right content and citation infrastructure two to three years ago. The brands that start building it now will see the benefits in a year. The brands that wait will face a structurally more expensive catch-up.
What Should CX SaaS Companies Actually Do?
Based on what the data shows, here is our recommended sequence for any growth-stage B2B SaaS company in the CX space that wants to close the gap with category leaders.
1. Fix the technical foundation first. Before investing another dollar in content or links, audit and fix orphan pages, metadata issues, image compression, and internal link architecture. These fixes have the highest ratio of impact to cost of anything on this list. Treat the first month as infrastructure.
2. Map your full content gap by cluster, not by keyword. Individual keyword lists are insufficient. The structural opportunity is in clusters, groups of related terms that all require the same type of content asset. Build cluster-level content (hub pages plus supporting articles) rather than one-off posts.
3. Prioritise BOFU product pages for core market categories. If you are a CX SaaS company without dedicated landing pages for employee engagement surveys, NPS software, CSAT management, and customer feedback platforms, these are the pages to build first. They do not require extraordinary content; they require the right structure, the right keywords, and enough inbound links from relevant domains.
4. Build educational content around the concepts your buyers measure themselves by. NPS benchmarks. CSAT calculation methodologies. Voice of Customer frameworks. 360 feedback best practices. These topics live in your ICP's intellectual world. Owning them educationally creates the top-of-funnel authority that compounds into BOFU performance over time.
5. Treat review and directory presence as AI infrastructure, not just referral traffic. G2, Capterra, GetApp, TrustRadius, and category-specific directories are not just conversion tools. They are the citation sources that AI models trust. Your depth of presence on these platforms directly affects how AI systems evaluate and recommend your product.
6. Pursue niche editorial links before volume links. One link from a CX-specialist publication, an HR analytics blog, or a UX research platform is worth more, in both SEO and GEO terms, than fifty generic directory links. Build a target list of 30–50 niche-relevant domains and develop a genuine content relationship with each one.
Closing Thought
The gap between category leaders and challengers in CX SaaS is not fundamentally a product gap, a funding gap, or a sales gap. In most cases, the products are comparable. The funding is real. The sales teams are capable.
The gap is a discoverability gap.
The leaders are found, by Google, by AI models, by buyers doing their own research, because they invested years ago in the infrastructure that makes them findable: technically sound sites, topically authoritative content libraries, high-quality referral networks, and deep presence on the platforms that shape AI-generated recommendations.
The challengers are building the same infrastructure now. The question is whether they are doing it with the structural clarity and sequencing the data suggests, or whether they are investing heavily in the visible things (brand content, paid search, event sponsorships) while the compounding, organic infrastructure remains underdeveloped.
The data suggests the latter is still the norm. But the gap is closable. It just requires starting with the right problems, in the right order, with the right level of investment.
What is the organic traffic gap between B2B CX SaaS companies?
Across six B2B CX SaaS companies analyzed, the organic traffic gap reaches 150× between the category leader and the lowest-performing company. The referring domain gap is 5,141 domains between the most-linked and least-linked company. These gaps reflect years of compounding SEO investment rather than short-term ranking differences, making them structurally difficult to close through content production alone without simultaneous authority building.
What content funnel pattern appears across CX SaaS companies?
All six CX SaaS companies show a content funnel inversion: they publish disproportionately more awareness-stage content (thought leadership, industry trends) than decision-stage content (comparison pages, pricing guides, ROI calculators, integration documentation). This creates high visibility at the research phase but leaves buyers without the structured commercial information AI engines use to generate vendor recommendations for purchase-intent queries.
How do CX SaaS companies compare on AI citation visibility?
AI visibility in B2B CX SaaS is highly concentrated. Companies with established editorial backlink profiles and FAQ-structured product pages earn the majority of ChatGPT and Perplexity citations for commercial queries. Companies relying on marketing narrative pages, regardless of domain authority, appear in zero AI answers for buyer-intent queries like 'best enterprise customer experience software.' The AI citation gap mirrors the organic gap but is not determined by it.
What technical SEO issue most commonly kills AI visibility in B2B SaaS?
Client-side JavaScript rendering on key product and comparison pages is the most consistent issue. Content delivered via JavaScript is invisible to AI retrieval crawlers (OAI-SearchBot, PerplexityBot) even when it ranks in Google (because Googlebot renders JavaScript). This creates a scenario where a page has organic traffic but zero AI citations. Migrating high-value pages to server-side rendering closes this gap without requiring a redesign.
rawmktg. publishes data-driven research on B2B marketing strategy, SEO, GEO, and AI search visibility for SaaS companies. Contact: vinayak@rawmktg.com